In the latest of our quarterly updates, we use our unique, national dataset to look at the key trends in the independent healthcare sector up to, and including, Q1 2024. The data covers reported private healthcare in-patient/day-case market activity, insured cases, ‘self-pay’, along with national/regional and procedural breakdowns and demographic information. (Q1 = Jan – Mar; Q2 = Apr – Jun; Q3 = Jul – Sep; Q4 Oct – Dec)
Private healthcare sector market activity
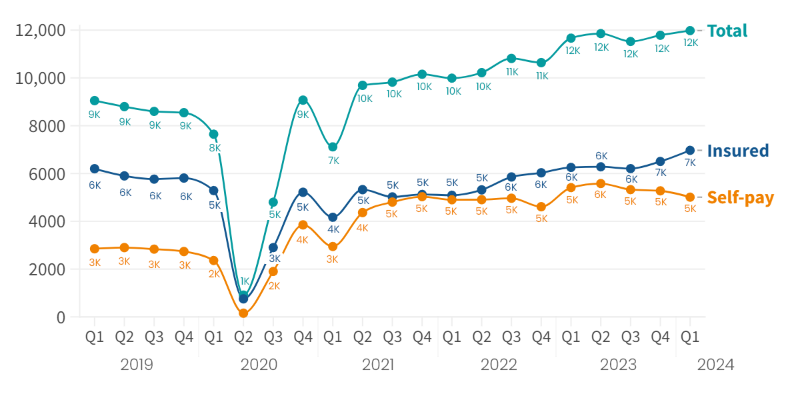
In-patient/day-care admissions comparison Q1 2019 – Q1 2024
Q1 2024 in Scotland at a glance
- There were over 11,980 reported private in-patient/day-care admissions in a quarter in Scotland, the highest ever quarterly total.
- The use of private medical insurance (PMI) was up 11% from the same quarter in 2023 and at a record high.
- Self-pay – where patients fund their own treatment from their savings, a loan or fundraising – reduced for the third quarter in a row and was 7% down on Q1 2023.
Record independent healthcare in-patient admissions in Scotland in Q1 2024
There were 11,980 reported admissions in Q1 2024, a 3% increase on the equivalent quarter in 2023, and a 1% increase from the previous highest quarter (Q2 2023).
There has been an increase in reported admissions in four of the past five quarters in Scotland.
Admission change by volume in Scotland (Q1 2023 v Q1 2024)
.png)
Private medical insurance admissions continue to grow as self-pay remains steady
Insured admissions
When comparing Q1 2024 to Q1 2023, the number of admissions funded by private medical insurance were up by 11% in Scotland. There was also a 7% increase on the previous quarter (Q4 2023), which had been the previous record high.
Admissions paid for with insurance have increased in eight of the last 10 quarters and have been above pre-pandemic levels for the past five quarters (since Q1 2023).
The proportion of people paying for treatment using insurance rose from 55% to 58% from Q1 2023 to Q1 2024.
Self-pay admissions
Self-pay admissions in Scotland have been falling for the past three quarters, although they remain significantly above the highest pre-pandemic levels.
Insured and Self-pay change by % (Q1 2023 v Q1 2024) (based on non-rounded figures)
.png)
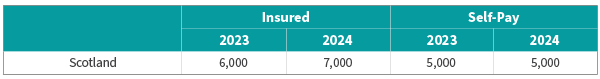
Admissions (rounded) in Scotland by payment method (Q1 2023 v Q1 2024)
Top 10 procedures (Q1 2023 v Q1 2024)
.png)
There was an increase in reported admissions in six of the top 10 procedures by volume when comparing Q1 2023 and Q1 2024.
‘Knee replacement’ had the biggest increase by volume (80) and percentage (22%).
‘Cataract surgery’ had the biggest decrease by volume (-445) and percentage (-21%) of procedures.
Active consultants in private healthcare
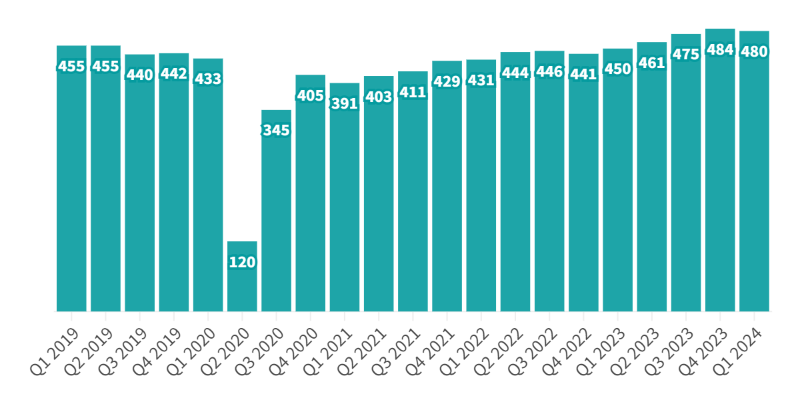
The number of consultants active in private healthcare regularly fluctuates, but remained high in Scotland in Q1 2024, down just 1% on Q4 2023, meaning it was the second highest level since PHIN began collecting data. The number of active consultants in Q1 2024 was 7% higher than Q1 2023.
Quarterly comparison of active consultants for the top 10 PHIN specialties (Q1 2023 v Q1 2024)
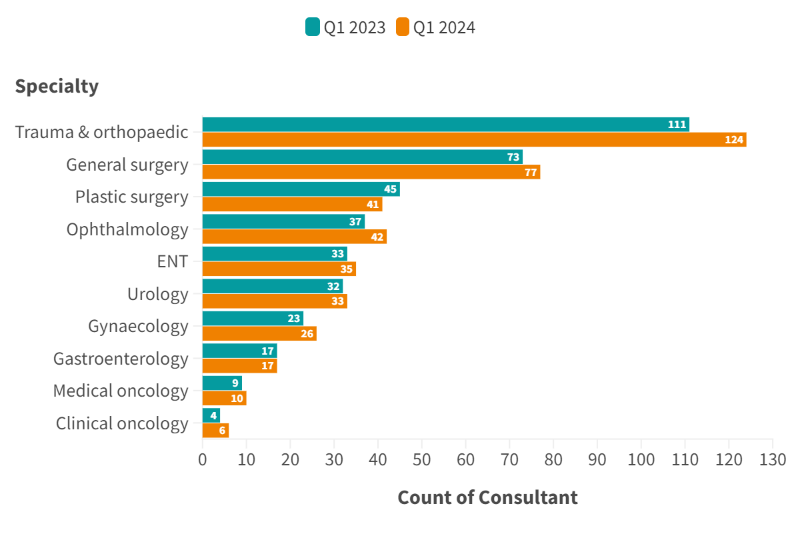
The largest increase in active consultants in the top 10 procedure groups by percentage was in ‘Ophthalmology’ at 14%. ‘Trauma & orthopaedics’ had the largest increase in volume (an extra 13 consultants) and the second largest percentage increase (12%).
Patient demographics
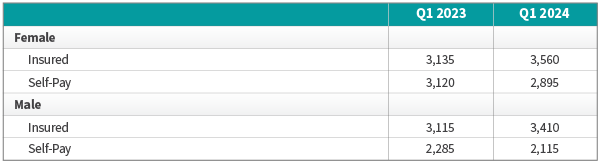
Volume of admissions by sex and payment method (Q1 2023 v Q1 2024)
There was an increased number of insured and self-pay admissions for both sexes compared to the same quarter in 2023.
Insured admissions for females both grew by 14%, and for males by 10%. They were at the same level in Q1 2023.
Self-pay admissions decreased at the same rate (7%) for both sexes, although in this case there were more female admissions.
The number of admissions was split evenly between the sexes which is quite unusual as there tend to be more female admissions than male ones.
Purchaser type and sex (Q1 2023 v Q1 2024)
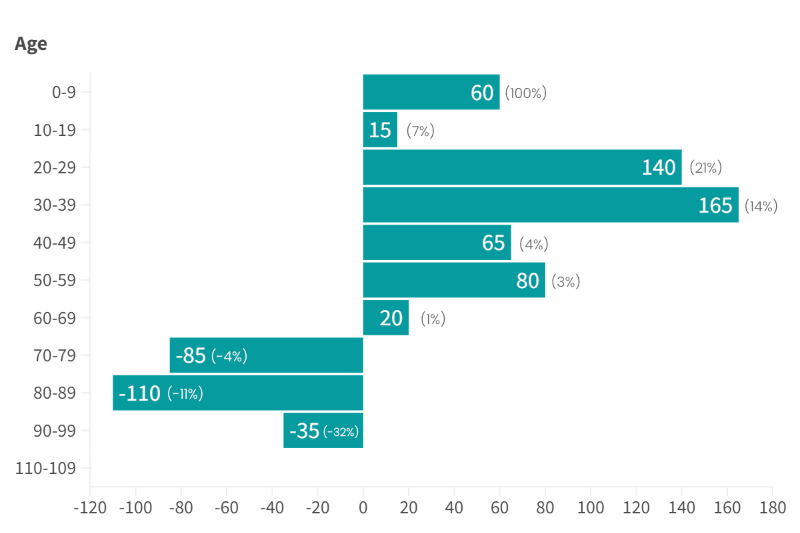
Change in volume of admissions by age
There was an increase in admissions in all age groups from Q1 2023 to Q1 2024 until the 70-79 and subsequent age-groups. The largest increase by volume was in the 30-39 age-group (165). The 20-29 age group had the second biggest increase by volume (140) and the 0-9 age group had the largest percentage increase (100%).
The 50-59 age-group, which is traditionally the highest user of private healthcare had one of the lowest percentage increases (3%).
The 80-89 age-group had the largest reduction in volume (-110) and the 90-99 age-group had the largest percentage decrease (-32%).
Important notes
All data described above taken from PHIN’s unique, national private dataset describing discharge activity (day case and inpatient). This excludes activity outside of PHIN’s mandate from the Competition and Markets Authority, such as outpatient diagnostics and mental health.
There is a time lag between collecting, validating and processing the data we receive from hospitals before we can publish it. This can be up to 6 months after treatment has been completed, to ensure a fair process and accurate data.
Activity numbers have been rounded to the nearest 5, with percentage based on the unrounded figures.