In the latest of our quarterly updates, we use our unique, national dataset to look at the key trends in the independent healthcare sector up to, and including, Q1 2024. The data covers private healthcare in-patient/day-case market activity, insured cases, ‘self-pay’, along with national/regional and procedural breakdowns and demographic information. (Q1 = Jan – Mar; Q2 = Apr – Jun; Q3 = Jul – Sep; Q4 Oct – Dec)
Private healthcare sector market activity
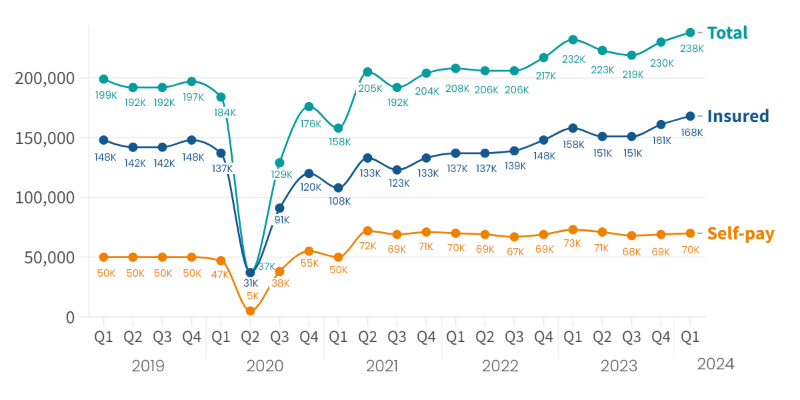
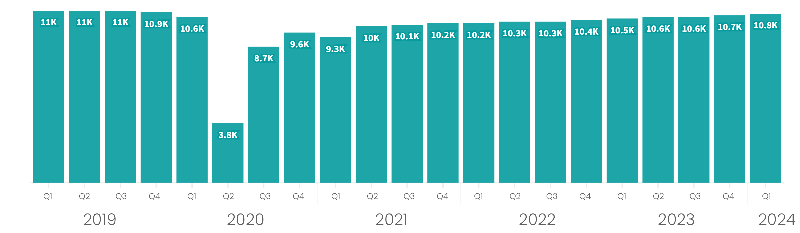
In-patient/day-care admissions comparison Q1 2019 – Q1 2024
Q1 2024 at a glance
- Private admissions at highest ever level for a quarter in the UK.
- Growth in use of private medical insurance (PMI) continues with second consecutive record quarter.
- PMI up 6% on same quarter in 2023.
- Self-pay remains steady, but 4% down on same quarter in 2023.
Record independent healthcare in-patient admissions in Q1 2024
There were 238,000 admissions in Q1 2024, a 3% increase on the former highest quarter (Q1 2023) and a 4% increase from the previous quarter (Q4 2023).
This was the second quarter increase in a row following a slight dip in Q2 and Q3 2023.
There were nearly 100,000 more admissions paid for by private medical insurance than by those ‘self-paying’. This is the biggest gap in the payment methods since before the Covid pandemic (Q4 2019). Self-pay has consistently been more popular than it was before the pandemic.
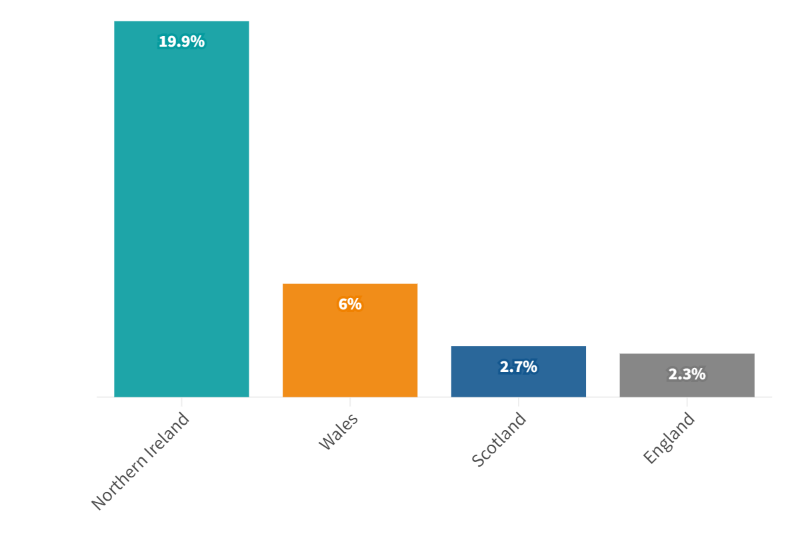
Admission change (%) by Nation (Q1 2023 v Q1 2024)
Private medical insurance admissions continue to grow as self-pay remains steady
Insured admissions
When comparing Q1 2024 to Q1 2023, the number of admissions funded by private medical insurance rose in every English region. The North East had the fewest insured admissions (2,000) in these quarters.
London continued to have the most insured admissions (rising from 56,000 to 61,000), followed by the South East (30,000 rising to 31,000).
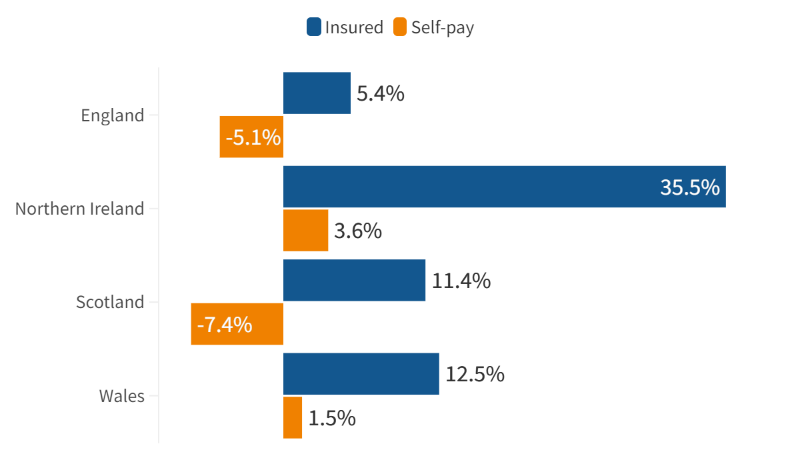
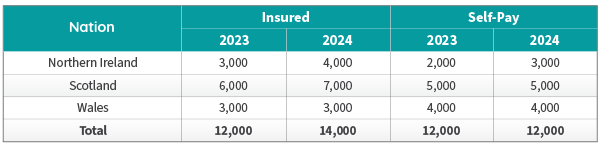
Insured admissions were also up in each of the devolved nations.
Self-pay admissions
Self-pay fell in every region except London when comparing Q1 2024 to Q1 2023, self-pay rose in London by 1,000 to 15,000 admissions.
Self-pay admissions also rose in Northern Ireland and Wales, but fell in Scotland.
Insured and Self-pay change (%) by Nation (Q1 2023 v Q1 2024) (based on non-rounded figures)
Admissions by English Region by payment method (Q1 2023 v Q1 2024)
.png)
Admissions by Devolved Nation by payment method (Q1 2023 v Q1 2024)
Top 10 procedures (Q1 2023 v Q1 2024)
.png)
There was an increased number of episodes in eight of the top 10 procedures by volume when comparing Q1 2023 and Q1 2024. Only ‘Therapeutics – Chemotherapy’ and ‘Diagnostic colonoscopy – bowel’ had fewer admissions.
Outside the Top 10, ‘Diagnostics – blood test’ had the biggest increase in admissions by percentage (192%) and was only just behind ‘Peripheral nerve block’ in terms of volume increase.
‘Spinal injection (facet joint injection or paravertebral block)’ had the largest decrease in episodes outside the Top 10 procedures at -585 (-42%).
Active consultants in private healthcare
The number of consultants active in private healthcare regularly fluctuates and was up 280 (2.7%) from Q1 2023 to Q1 2024. The number of active consultants in Q1 2024 was the highest Q1 figure since before the pandemic and the joint second highest of any quarter since the lockdowns.
Quarterly comparison of active consultants for the top 10 PHIN specialties (Q1 2023 v Q1 2024)
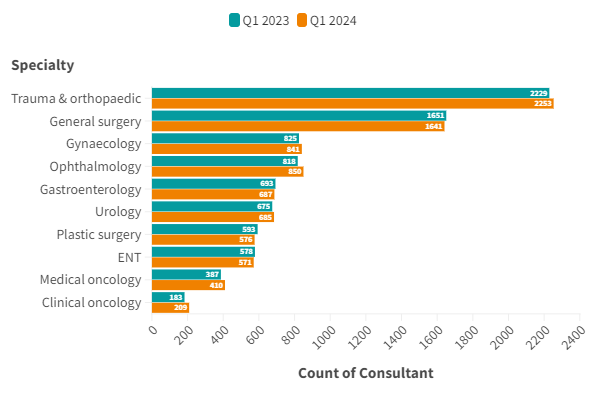
The largest increase in active consultants in the top 10 procedure groups was in ‘Ophthalmology’ with an extra 32 consultants (3.9%). ‘Clinical oncology’ had the second largest increase in volume (an extra 26 consultants) and the largest percentage increase (14%).
Three specialties ‘Gastroenterology’ (-6), and ‘Plastic surgery’ (-17), ‘ENT’ (-7) and ‘General Surgery’ (-10) all had reductions in the number of consultants.
Patient demographics
Volume of admissions by sex and payment method (Q1 2023 v Q1 2024)
There was an increased number of insured admissions and reduction in self-paid admissions for both sexes compared to the same quarter in 2023.
The growth in insured admissions for males was 5,000 (7%) compared to 4,825 (6%) for females.
The drop in self-pay was also more pronounced for male admissions at 2,025 (-7%) compared to 1,255 (-3%) for females.
Admissions for females continue to be higher than for males across both payment methods.
Purchaser type and sex (Q1 2023 v Q1 2024)
.png)
Change in volume of admissions by age
Admissions in all age groups up to and including 60-69 year-olds increased when comparing Q1 2023 and Q1 2024. The largest increase by volume and percentage came in the 30-39 year-old age group. However, this age group was still only the fifth highest for admissions with the most being in the 50-59 group.
The following three age groups (70-79, 80-89 and 90-99) all had a decrease before an increase in the 100-109 year-olds (+5).
%20updated.png)
Comparing Q1 2023 and Q1 2024, the use of insurance to pay for admissions was up in every age group except 70-79 year olds. The largest increase by volume was in the 30-39 year-old group. The largest percentage increase (13%) was shared by the 20-29 and 30-39 year-olds.
In contrast, the use of self-pay reduced in every age group except 0-9 and 100-109 year-olds where there was a slight increase. The largest decrease by volume came in the 70-79 year-old group (1,020) and the largest percentage decrease was for 90-99 year-olds (10%).
Important notes
All data described above taken from PHIN’s unique, national private dataset describing discharge activity (day case and inpatient). This excludes activity outside of PHIN’s mandate from the Competition and Markets Authority, such as outpatient diagnostics and mental health.
There is a time lag between collecting, validating and processing the data we receive from hospitals before we can publish it. This can be up to 6 months after treatment has been completed, to ensure a fair process and accurate data.
Activity numbers have been rounded to the nearest 5, with percentage based on the unrounded figures.