In the latest of our quarterly updates, we use our unique national dataset to look at the key trends in the independent healthcare sector up to, and including, Q3 2024. The data covers reported private healthcare in-patient/day-case market activity, insured cases, ‘self-pay’, along with national/regional and procedural breakdowns and demographic information. (Q1 = Jan – Mar; Q2 = Apr – Jun; Q3 = Jul – Sep; Q4 Oct – Dec)
Private healthcare sector market activity
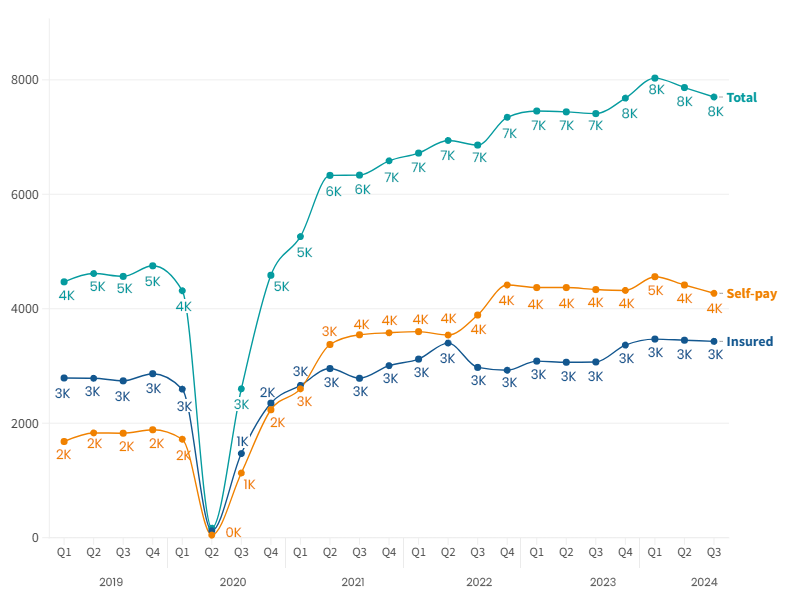
In-patient/day-care admissions comparison Q1 2019 – Q3 2024
Q3 2024 in Wales at a glance
- There were around 7,700 reported private in-patient/day-care admissions in Q3 2024, the third highest quarter on record.
- Wales remains the only UK nation where self-pay – where patients fund their own treatment from their savings, a loan or fundraising – is the dominant payment method.
- Self-pay admissions declined (-1%) to the same level as Q3 2023, but still higher than pre-COVID activity.
- The use of private medical insurance (PMI) was increased 12% from Q3 2023. These are the highest since Q2 2022.
Record independent healthcare in-patient admissions in Wales in Q3 2024
Reported admissions were 7,700 in Q3 2024, meaning they are at their third highest level ever (after Q1 & Q2 2024). The Q3 decline from Q1 and Q2 suggest Wales is following the national seasonal variation in private admissions.
Admission change by percentage in Wales (Q3 2023 v Q3 2024)
%20by%20Nation%20(Q3%202023%20v%20Q3%202024).png)
Private medical insurance admissions continue to grow as self-pay starts to decline
Insured admissions
When comparing Q3 2024 to Q3 2023, the number of admissions funded by private medical insurance were up by 12% in Wales.
Self-pay admissions
Self-pay admissions in Wales have remained fairly consistent over the past seven quarters, but reached their highest ever level in Q1 2024. In Q3 2024, they have reduced to the same level as Q3 2023.
Since Q2 2021, self-pay has been the dominant payment method in Wales. Wales remains the only nation where self-pay is the dominant payment method. In Q3 2023, 57% of private admissions are funded through self-pay.
Insured and Self-pay change % (Q3 2023 v Q3 2024) (based on non-rounded figures)
%20(Q3%202023%20v%20Q3%202024)%20.png)
Top 10 procedures (Q3 2023 v Q3 2024)
.png)
There was an increase in reported admissions in three of the Top 10 procedures by volume when comparing Q3 2023 and Q3 2024.
‘Cataract surgery’ had the biggest increase by volume (250).
‘Colonoscopy – therapeutic’ had the biggest decrease by percentage (-17%).
Active consultants in private healthcare
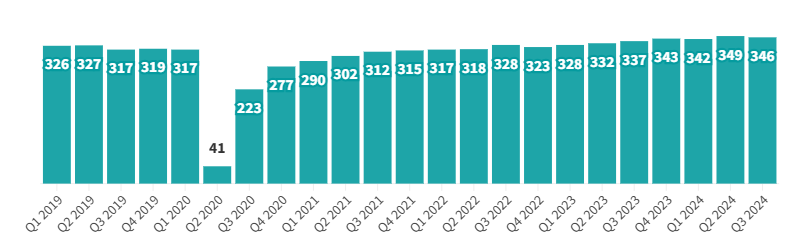
The number of consultants active in private healthcare was at the second highest level in Wales since the pandemic and second highest since PHIN began collecting data. The number of active consultants in Q3 2024 was 3% higher than Q3 2023.
Quarterly comparison of active consultants for the top 10 PHIN specialties (Q3 2023 v Q3 2024)
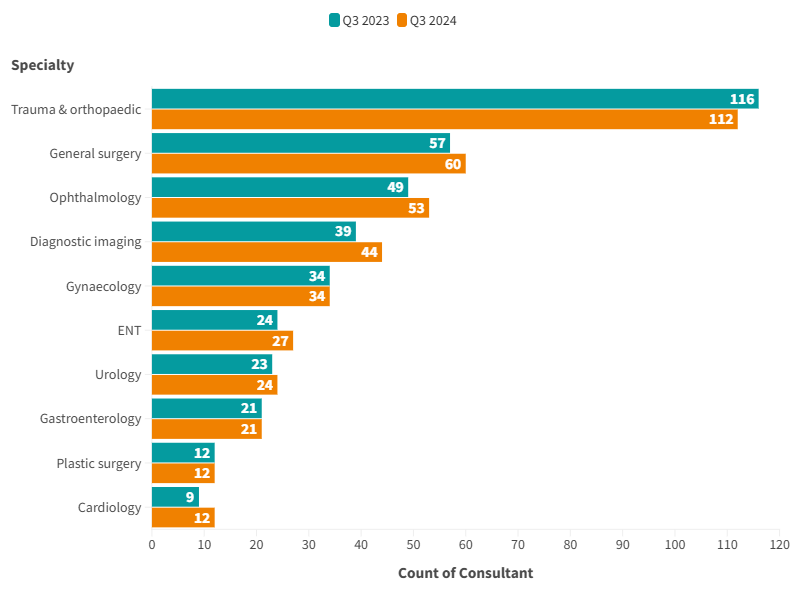
There was no change or an increase in the number of active consultants across all Top 10 specialties in Wales, except for ‘Trauma and Orthopaedics’. The largest increase by percentage (12.8%) was consultants working in ‘Diagnostic Imaging’.
Patient demographics
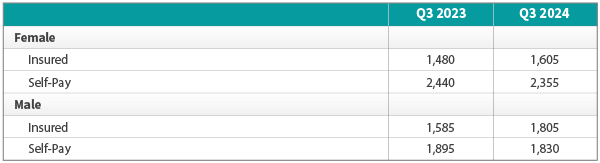
Volume of admissions by sex and payment method (Q3 2023 v Q3 2024)
There was an increased number of insured admissions for both sexes compared to the same quarter in 2023.
Insured admissions for female patients grew by 8%, and for male patients by 14%.
Self-pay admissions decreased for female (-3%) and males (-3%) patients.
Purchaser type and sex (Q3 2023 v Q3 2024)
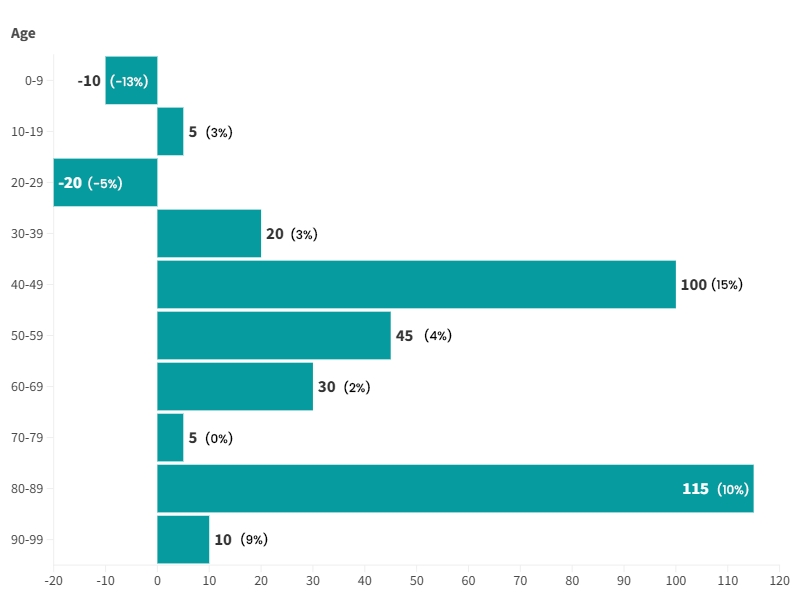
Change in volume of admissions by age
There was a decrease in admissions in the age groups from 20-89 from Q3 2023 to Q3 2024. The largest increase by volume and percentage was in the 40-49 age-group (100, 15%). The second largest volume and percentage increase was in the 80-89 year olds.
Wales was the only nation in the UK not to have any admissions in the 0-9 and 10-19 age groups.
Important notes
All data described above taken from PHIN’s unique, national private dataset describing discharge activity (day case and inpatient). This excludes activity outside of PHIN’s mandate from the Competition and Markets Authority, such as outpatient diagnostics and mental health.
There is a time lag between collecting, validating and processing the data we receive from hospitals before we can publish it. This can be up to 6 months after treatment has been completed, to ensure a fair process and accurate data.
Activity numbers have been rounded to the nearest 5, with percentage based on the unrounded figures.