In the latest of our quarterly updates, we use our unique, national dataset to look at the key trends in the independent healthcare sector in Scotland up to, and including, Q3 2024. The data covers reported private healthcare in-patient/day-case market activity, insured cases, ‘self-pay’, along with national/regional and procedural breakdowns and demographic information. (Q1 = Jan – Mar; Q2 = Apr – Jun; Q3 = Jul – Sep; Q4 Oct – Dec)
Private healthcare sector market activity
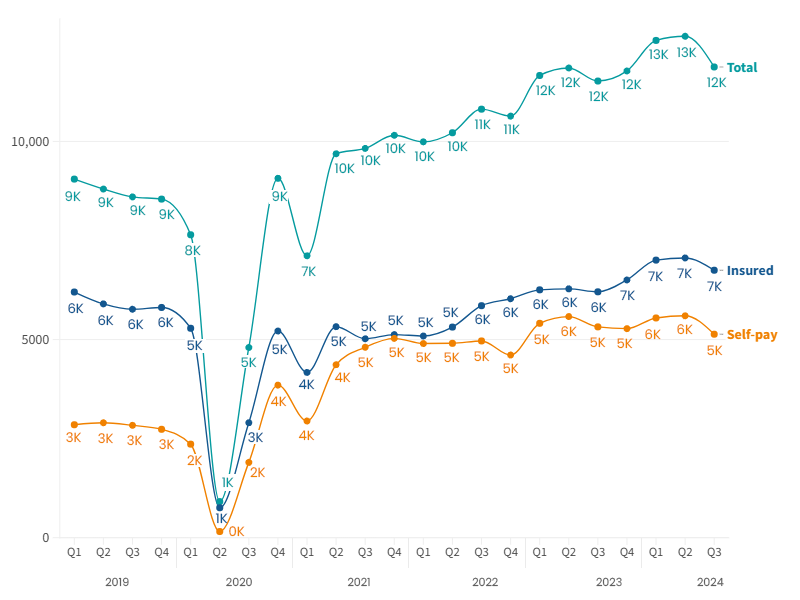
In-patient/day-care admissions comparison Q1 2019 – Q3 2024
Q3 2024 in Scotland at a glance
- There were 11,880 reported private in-patient/day-care admissions in Scotland, the third highest quarter ever.
- Like the UK which had a seasonal decrease, figures have decreased from Q2 2024.
- Admissions up 3% from Q3 2024.
- The use of private medical insurance (PMI) was up 9% from the same quarter in 2023.
- Self-pay – where patients fund their own treatment from their savings, a loan or fundraising – decreased –3% on Q3 2023, and was down -8% compared to Q2 2024.
Record independent healthcare in-patient admissions in Scotland in Q3 2024
There were 11,880 reported admissions in Q3 2024, a 3% increase on the equivalent quarter in 2023, and a 6% decrease from the previous quarter (Q2 2024).
Admission change by volume in Scotland (Q3 2023 v Q3 2024)
%20by%20Nation%20(Q3%202023%20v%20Q3%202024).png)
Private medical insurance admissions continue to grow and self-pay is unchanged
Insured admissions
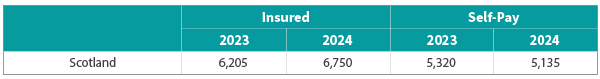
When comparing Q3 2024 to Q3 2023, the number of admissions funded by private medical insurance were up by 9% in Scotland. There was a 4% decrease on the previous quarter (Q2 2024), following seasonal trends.
This is the first quarter where admissions paid for with insurance have decreased after increasing consecutively for the previous three quarters. This follows the previous year’s trend of Q3 being the lowest quarter.
The proportion of people paying for treatment using insurance rose from 55% to 58% from Q3 2023 to Q3 2024.
Self-pay admissions
Self-pay admissions in Scotland had been falling since Q2 2023. Q3 2024 (5,135) is the lowest quarter for self-pay admissions since Q4 2022 (4,610).
Insured and Self-pay change by % (Q3 2023 v Q3 2024) (based on non-rounded figures)
%20(Q3%202023%20v%20Q3%202024)%20.png)
Admissions (rounded) in Scotland by payment method (Q3 2023 v Q3 2024)
Top 10 procedures (Q3 2023 v Q3 2024)
.png)
There was an increase in 5 of the top 10 procedures by volume when comparing Q3 2023 and Q3 2024.
‘Knee arthroscopy had the biggest increase by volume (95) biggest percentage increase (25%) of the Top 10 procedures.
Active consultants in private healthcare
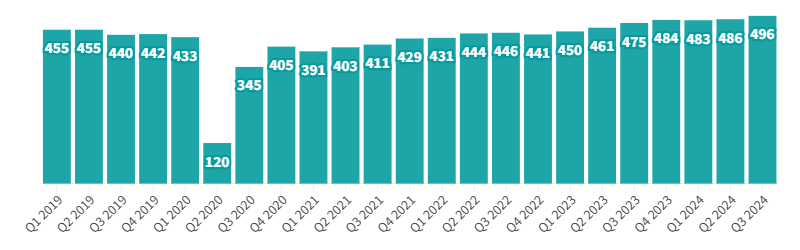
The number of consultants active (496) in private healthcare reached its highest ever level in Scotland in Q3 2024, up 4% on Q3 2023.
Quarterly comparison of active consultants for the top 10 PHIN specialties (Q3 2023 v Q3 2024)
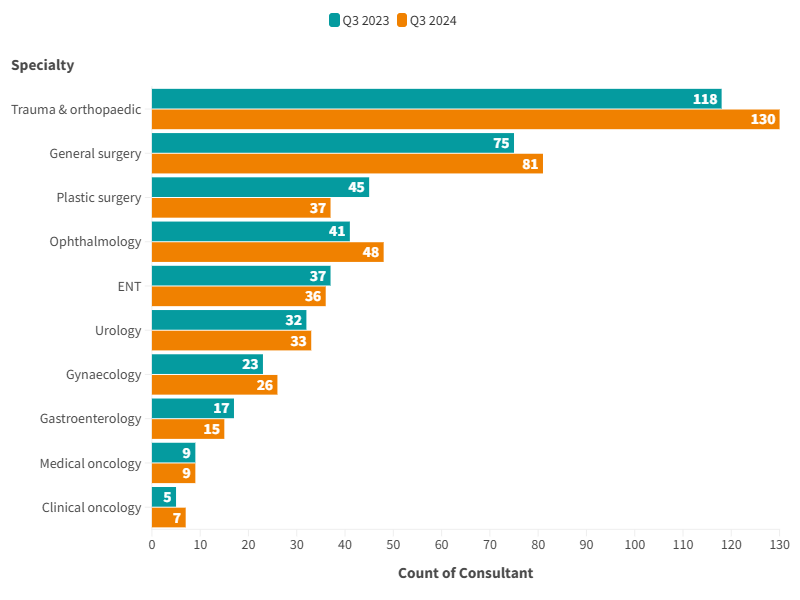
The largest increase in active consultants in the top 10 procedure groups by percentage (10%) was in ‘Trauma & orthopaedics’. The only specialties with fewer active consultants than in Q3 2023 are:
- Plastic surgery -18%
- ENT -3%
- Gastroenterology -12%
Patient demographics
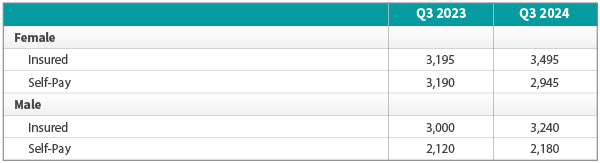
Volume of admissions by sex and payment method (Q3 2023 v Q3 2024)
There was an increased number of insured admissions for both male (6%) and females (1%) compared to the same quarter in 2023.
Insured admissions for females grew by 9%, and for males by 8%.
For self-pay, female patient admissions reduced (-8%) and male patient admissions rose (3%).
Purchaser type and sex (Q3 2023 v Q3 2024)
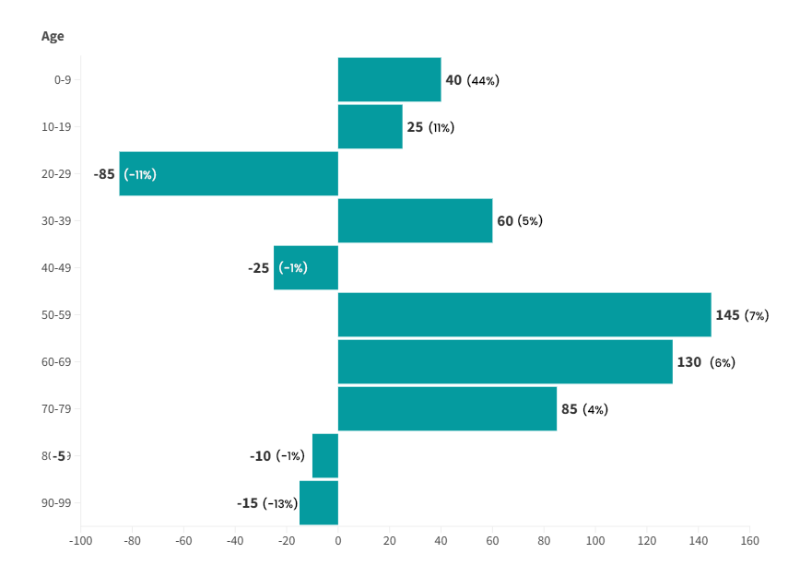
Change in volume of admissions by age
There was an increase in admissions in most age groups from Q3 2023 to Q3 2024 except for 20-29, 40-49, 80-89 and 90-99. The largest increase by volume was in the 50-59 age-group (145). The 0-9 age group had the biggest increase by percentage increase (44%).
The 50-59 age-group is traditionally the highest user of private healthcare but had the third largest percentage change after 0-9 and 10-19.
The 20-29 group had the largest reduction in volume (-85)
Important notes
All data described above taken from PHIN’s unique, national private dataset describing discharge activity (day case and inpatient). This excludes activity outside of PHIN’s mandate from the Competition and Markets Authority, such as outpatient diagnostics and mental health.
There is a time lag between collecting, validating and processing the data we receive from hospitals before we can publish it. This can be up to 6 months after treatment has been completed, to ensure a fair process and accurate data.
Activity numbers have been rounded to the nearest 5, with percentage based on the unrounded figures.