In the latest of our quarterly updates, we use our unique, national dataset to look at the key trends in the independent healthcare sector up to, and including, Q3 2024. The data covers private healthcare in-patient/day-case market activity, insured cases, ‘self-pay’, along with national/regional and procedural breakdowns and demographic information. (Q1 = Jan – Mar; Q2 = Apr – Jun; Q3 = Jul – Sep; Q4 Oct – Dec)
Private healthcare sector market activity
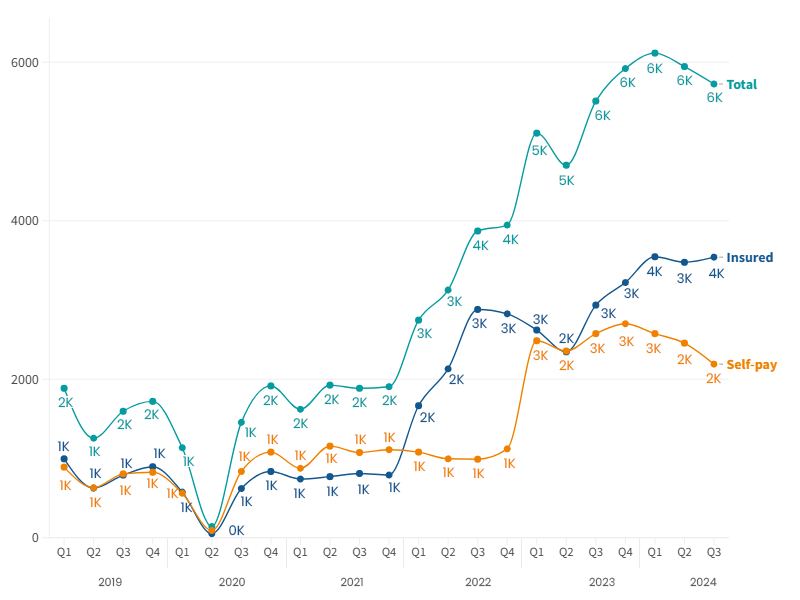
In-patient/day-care admissions comparison Q1 2019 – Q3 2024
Q3 2024 in Northern Ireland at a glance
- There were over 5,700 reported private in-patient/day-care admissions.
- This is the fourth highest total ever and the highest for Q3 period.
- There was a small decline (3%) from Q2.
- The use of private medical insurance (PMI) was up 21% from the same quarter in 2023.
- Self-pay – where patients fund their own treatment from their savings, a loan or fundraising – decreased (-15%) on same quarter in 2023.
Independent healthcare in-patient admissions in Northern Ireland in Q3 2024
There were 5,725 reported admissions in Q 2024, a 4% increase on the equivalent quarter in 2023 (5,510), and a 6% decrease from the highest quarter (Q1 2024) ever.
Q3 usually has lower admissions than Q2 at a UK level and Northern Ireland has also seen this pattern in 2024. Overall, there has been a steady rise in the number of reported admissions in Northern Ireland since Q3 2021.
Previous increases in 2022 may have been due to more complete data submission from private hospitals in Northern Ireland. This has improved and allows for a more meaningful picture of activity in 2024.
Admission change by percentage in Northern Ireland (Q3 2023 v Q3 2024)
%20by%20Nation%20(Q3%202023%20v%20Q3%202024).png)
Private medical insurance admissions continue to grow as self-pay remains steady
Insured admissions
When comparing Q3 2024 to Q3 2023, the number of admissions funded by private medical insurance were up by 21% in Northern Ireland.
Self-pay admissions
Self-pay admissions in Northern Ireland were down from the same quarter in 2023 (-15%), and down (-10%) on the previous quarter (Q2 2024).
The proportion of people in Northern Ireland paying for treatment using insurance continue to increase to 66% in Q3 2024. Comparing to the UK, 71% of admissions are funded by insurance.
Insured and Self-pay change by % (Q3 2023 v Q3 2024) (based on non-rounded figures)
%20(Q3%202023%20v%20Q3%202024)%20.png)
Top 10 procedures (Q3 2023 v Q3 2024)
.png)
There was an increase in reported admissions in all of the top 10 procedures by volume when comparing Q1 2023 and Q1 2024.
‘Cataract surgery’ had the biggest increase at 284% when compared to Q3 2023. These large rises when comparing previous years are likely to be a combination of an increase in admissions combined with more complete data submission to PHIN.
Active consultants in private healthcare
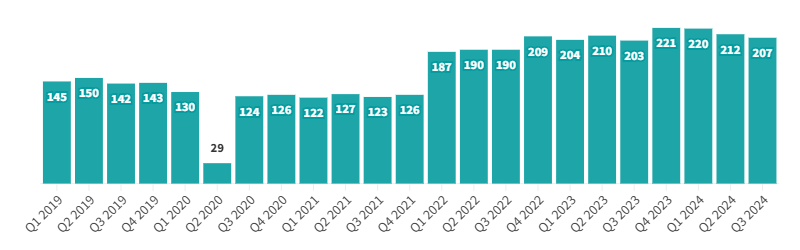
Although down on the previous two quarters, the number of consultants active in private healthcare remains high in Northern Ireland in Q3 2024, down just 2% on Q2 2024. The number of active consultants in Q3 2024 was 2% higher than Q3 2023.
Quarterly comparison of active consultants for the top 10 PHIN specialties (Q3 2023 v Q3 2024)
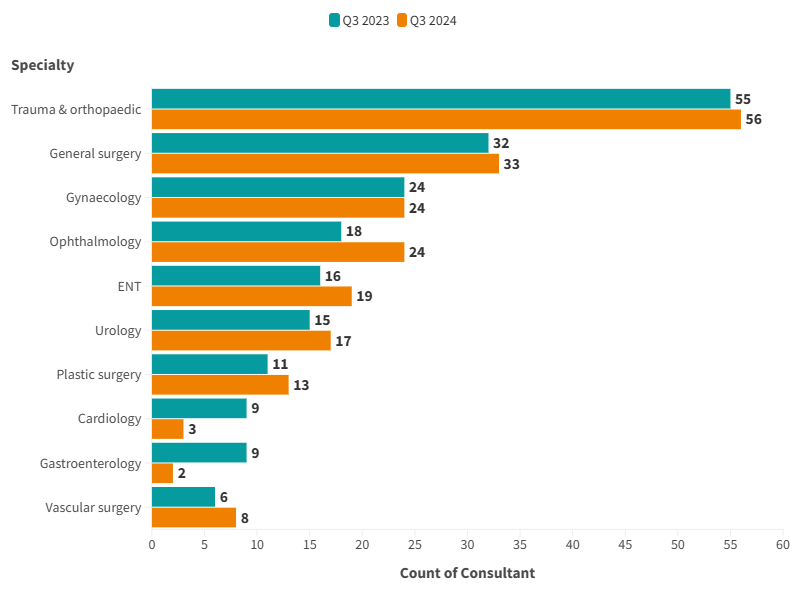
There was an increase in active consultants in seven of the Top 10. The largest increase was in ‘Ophthalmology’ and ‘Vascular surgery’ with 33% increase. The largest fall was in ‘Cardiology’ where there were six fewer active consultants (-66%).
Patient demographics
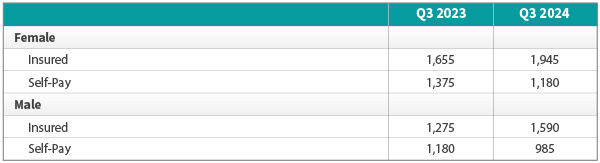
Volume of admissions by sex and payment method (Q3 2023 v Q3 2024)
There was an increased number of insured admissions for both sexes and for female self-pay admissions compared to the same quarter in 2023. Male and female self-pay admissions were down from Q3 2023.
Insured admissions for females grew by 18% and males by 25%. The number of females and males using insurance is also higher.
Self-pay admissions decreased by 14% for female patients and 17% for male patients.
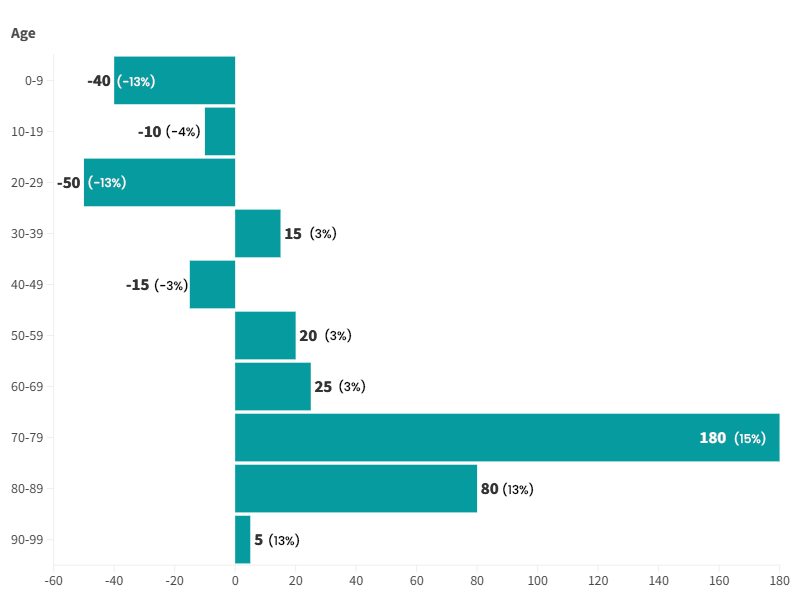
Change in volume of admissions by age
There was an increase in admissions in 30-39 and 50+ age groups from Q3 2023 to Q3 2024 (except for those aged 100 or above for whom there were no admissions).
The largest increase in terms of volume and percentage was in the 70-79 age-group (180, 15%). There was a decrease in admissions in 0-9, 10-19, 20-29 and 40-49.
Important notes
All data described above taken from PHIN’s unique, national private dataset describing discharge activity (day case and inpatient). This excludes activity outside of PHIN’s mandate from the Competition and Markets Authority, such as outpatient diagnostics and mental health.
There is a time lag between collecting, validating and processing the data we receive from hospitals before we can publish it. This can be up to 6 months after treatment has been completed, to ensure a fair process and accurate data.
Activity numbers have been rounded to the nearest 5, with percentage based on the unrounded figures.