In the latest of our quarterly updates, we use our unique, national dataset to look at the key trends in the independent healthcare sector up to, and including, the end of 2023 in Wales. The data covers private healthcare in-patient/day-case market activity, insured cases, ‘self-pay’, along with national/regional and procedural breakdowns and demographic information. (Q1 = Jan – Mar; Q2 = Apr – Jun; Q3 = Jul – Sep; Q4 Oct – Dec)
Private healthcare sector market activity
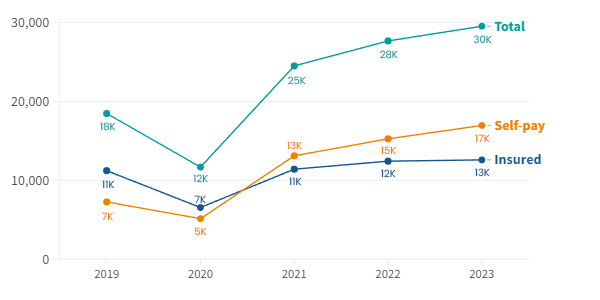
Private hospital admissions by year 2019-2023
Wales - At a glance
2023 v 2022:
- Total private admissions up 7%.
- Self-pay admissions up 11% and at highest level ever.
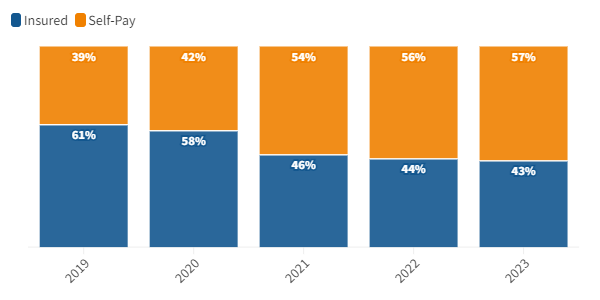
- Wales the only nation in the UK with higher levels of self-pay admissions than insured
- Private medical insurance admissions up 1% and also at record levels.
- Third year in a row that admissions are at above pre-pandemic levels.
2023 v 2019
- Total private admissions up 60%.
- Self-pay admissions up 134%
- Insured admissions up 12%
Record independent healthcare in-patient admissions in 2023
The total number of private hospital admissions in Wales was 30,000 (7% above 2022) meaning the private sector had more admissions than in any previous year on record for the third year in a row.
Admissions in Q4 2023 were at the highest levels recorded. They were 7% above the equivalent quarter in 2022, with self-pay admissions up 1% and insured admissions up 15%.
Self-pay admissions were at their highest ever levels in Q4 2023 and were 129% higher than in Q4 2019.
Private medical insurance and self-pay admissions at record annual levels
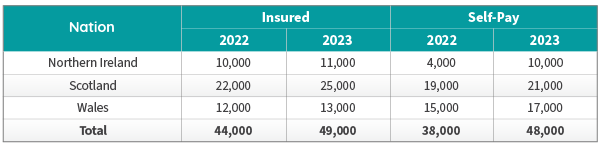
Self-pay continued to grow in all the devolved nations in 2023: Northern Ireland (144%), Scotland (8%) and Wales (11%) were all above 2022 figures.
Admissions by Devolved Nation by payment method
Proportion of Insured vs Self-pay admissions in Wales
Top 10 procedures (2022 v 2023)
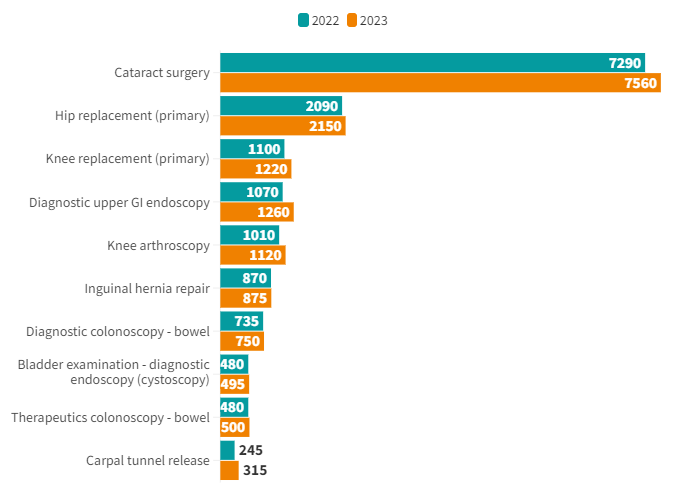
The biggest increases by volume in admissions in the Top 10 procedures were for ‘Cataract surgery’. These increased by 270 (4%). The next biggest volume increase was in ‘Diagnostic upper GI endoscopy’ at 190 (18%).
The biggest increase by percentage was ‘Carpal tunnel release’ at 29%.
None of the Top 10 procedures reduced in volume in 2023 compared to 2022. Outside the Top 10 two types of endoscopy (Therapeutic upper GI and Nose diagnostic examination) were the biggest fallers by volume (-60 and -80 respectively).
Active consultants in private healthcare by year
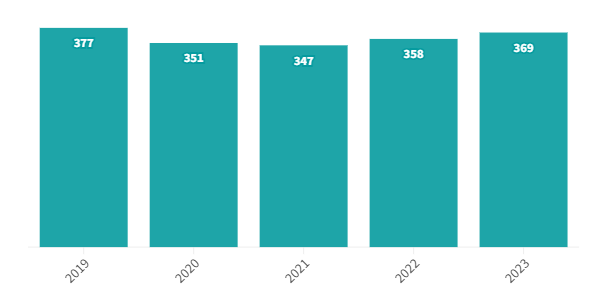
The number of consultants active in private healthcare regularly fluctuates as new ones start and others leave the profession. The number of active consultants in Wales has yet to return to pre-pandemic levels, but in 2023 it reached the highest level since 2019.
Comparison of active consultants for the top 10 PHIN specialties (2022 v 2023)
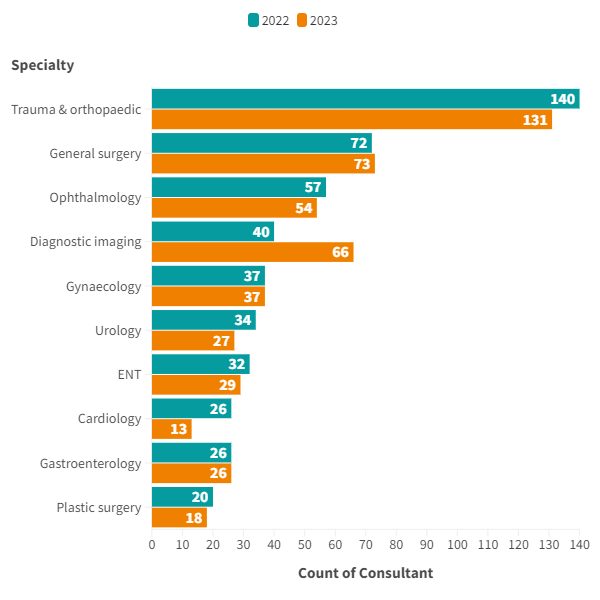
The largest increase by volume and percentage in active consultants in the top 10 procedure groups was in ‘Diagnostic imaging’ with an extra 26 consultants (65%). General surgery was the only other specialty in the Top 10 with an increase (1%).
The other 8 procedures either stayed the same or saw a reduction in active consultants, with ‘Cardiology’ seeing the biggest decline (50%) to 13 consultants.
The overall increase in active consultants despite these drops is explained by the fact more consultants were active in non-Top 10 specialties in 2023.
Patient demographics
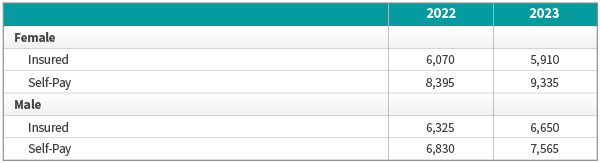
Volume of admissions by sex and payment method
There was an increased number of self-pay admissions for both sexes (both up 11%) in 2023 compared to 2022.
Insured admissions were up for males (5%) but down for females (-3%) compared to 2022.
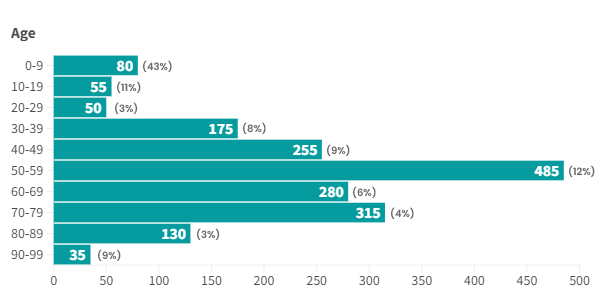
Volume of admissions by age
There was an increase in admissions in all age groups in 2023 compared to the previous year. The largest percentage increases were in the 0-9 (43%) and 50-59 (12%) age groups.
The most common age group for private admissions was 50-59 (485 admissions) and 70-79 (315 admissions).
Private admissions by age group
Important notes
All data described above taken from PHIN’s unique, national private dataset describing discharge activity (day case and inpatient). This excludes activity outside of PHIN’s mandate from the Competition and Markets Authority, such as outpatient diagnostics, physiotherapy and mental health services.
There is a time lag between collecting, validating and processing the data we receive from hospitals before we can publish it. This can be up to 6 months after treatment has been completed, to ensure a fair process and accurate data.
Activity numbers have been rounded to the nearest 5, with percentage based on the unrounded figures.