In the latest of our quarterly updates, we use our unique, national dataset to look at the key trends in the independent healthcare sector up to, and including, Q3 2024. The data covers private healthcare in-patient/day-case market activity, insured cases, ‘self-pay’, along with national/regional and procedural breakdowns and demographic information. (Q1 = Jan – Mar; Q2 = Apr – Jun; Q3 = Jul – Sep; Q4 Oct – Dec)
Private healthcare sector market activity
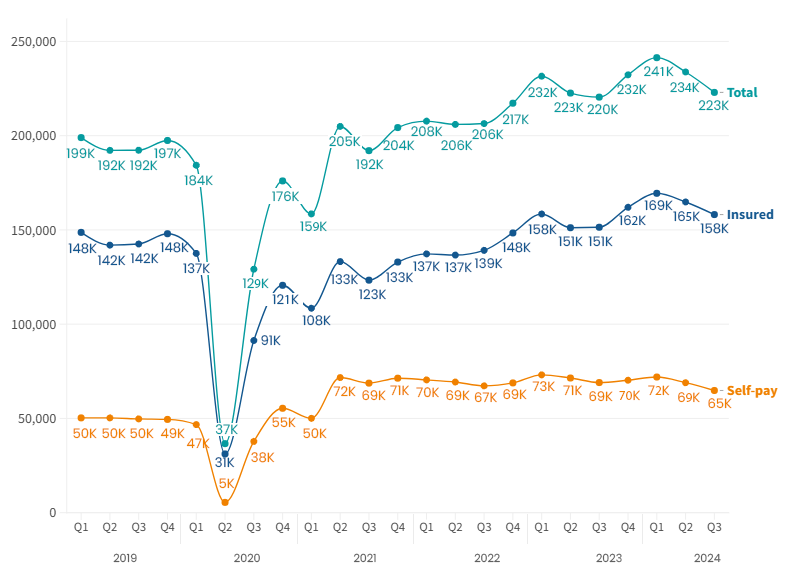
In-patient/day-care admissions comparison Q1 2019 – Q3 2024
Q3 2024 at a glance
- Highest Q3 in any year on record for private hospital admissions
- Fifth highest quarter for total admissions on record, up 1% on Q3 2023
- Private medical insurance (PMI) up 9% on same quarter in 2023
- Self-pay slow decline, 6% down on same quarter in 2023
- Reduction in reported admissions for several cosmetic breast procedures
- Growth in private surgery for endometriosis treatment
- Use of robotic surgery continues to increase in the private sector
Independent healthcare in-patient admissions in Q3 2024
There were 223,000 admissions in Q3 2024, a 1% increase the same period in 2023.
There was a small decrease in admissions (5%) from Q2 2024, but this follows the seasonal pattern of 2023.
The gap in admissions between those paying with PMI and those using ‘self-pay’ narrowed to 93k admissions, due to a larger decrease in PMI than self-pay.
Self-pay has consistently been more popular than it was before the pandemic and remains 30% above pre-pandemic levels (Q3 2019), despite a sustained decline.
Admission change (%) by Nation (Q3 2023 v Q3 2024)
%20by%20Nation%20(Q3%202023%20v%20Q3%202024).png)
Northern Ireland and Wales reported the biggest growth of 3.9%.
England had the smallest level of growth, but has the highest volumes of admissions. There was an increase in admissions in every English region except:
- East of England (-3%)
- North West (-1.8%)
- South East (-0.8%)
- South West (-3.1%)
- Yorkshire and The Humber (-0.4%)
Admissions by Region and payment method (rounded figures)
.png)
Private medical insurance admissions continue to grow as self-pay remains steady
Insured admissions
When comparing Q3 2024 to Q3 2023, the number of admissions funded by private medical insurance rose in every English region.
London once again had the most insured admissions (rising from 55,000 to 58,000), followed by the South East (28,000).
Insured admissions were also up in Northern Ireland, Scotland and Wales.
Self-pay admissions
Self-pay fell in all English regions when comparing Q3 2024 to Q3 2023. The was no significant change in the other English regions or devolved nations.
Insured and Self-pay change (%) by Nation (Q3 2023 v Q 2024) (based on non-rounded figures)
%20by%20Nation%20(Q3%202023%20v%20Q3%202024).png)
Top 10 procedures (Q3 2023 v Q 2024)
.png)
There was an increased number of episodes in seven of the top 10 procedures by volume when comparing Q3 2023 and Q3 2024. Therapeutics – chemotherapy had the largest increase (9%).
We now report hip and knee replacement surgery separately with and without robot-assistance. Traditional hip and knee replacement surgery decreased by 10% (735) and 11% (500) respectively. Robotic assisted surgery for hip and knee replacements has increased 40% (525) and 46% (760) when compared to Q3 2023. See our report A helping hand for more information on this type of assisted surgery.
Outside the Top 10 procedures, breast lifts (-27%) and reductions (-13%) were all down from Q3 2023, as were face lifts (-16%) and tummy tucks (-10%). Weight loss surgery was also down for gastric bypass surgery (-23%), gastrectomy (-14%) and gastric ballon insertion (-22%). These are all often cosmetic procedures which aren’t usually available on the NHS or through PMI.
Active consultants in private healthcare
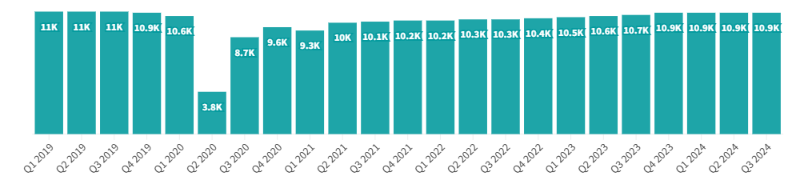
The number of consultants active in private healthcare regularly fluctuates and was up 202 (1.9%) from Q3 2023 to Q3 2024. The number of active consultants (10,900) in Q3 2024 remains the highest since the pandemic.
Quarterly comparison of active consultants for the top 10 PHIN specialties (Q3 2023 v Q3 2024)
.png)
The largest increase in active consultants in the top 10 procedure groups was in ‘Clinical oncology’ had the second largest increase in volume (an extra 19 consultants) and the largest percentage increase (10.4%).
The following specialities in the Top 10 had a reduction in the number of active consultants:
- Trauma and Orthopaedics decreased by 9 consultants (<1%)
- Gynaecology decreased by 15 consultants (2%)
- Medical Oncology decreased by 7 consultants (2%).
Patient demographics
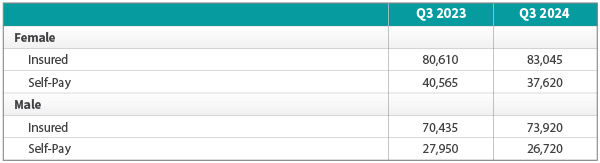
Volume of admissions by sex and payment method (Q3 2023 v Q3 2024)
There was an increased number of insured admissions and reduction in self-paid admissions for both sexes compared to the same quarter in 2023.
The growth in insured admissions for males was 3,500 (4.9%) compared to 3,300 (4.1%) for females.
The drop in self-pay was also at a similar level for male admissions at 1,300 (-4.4%) compared to 3,000 (-7.3%) for females.
Admissions for females continue to be higher than for males across both payment methods.
Purchaser type and sex (Q3 2023 v Q3 2024)
Comparing Q3 2023 and Q3 2024, the use of insurance to pay for admissions was up in every age from 0 to 69. The largest increase by volume was in the 40-49 year-old group (1,980, 7%). The largest percentage increase (13%) was in the 10-19 year old group. This is the same pattern seen in Q2 2024.
Admissions funded by insurance declined for the age groups 70-79 (-2%), 80-89% (-3%) and 90-99 (-9%).
In contrast, the use of self-pay reduced in every age group except 10-19 year-olds where there was a slight (1%) increase. The largest decrease by volume came in the 70-79 year-old group (-1,200, 7%) and the largest percentage decrease was for 40-49 year olds and 90-99 year-olds (10%).
Important notes
All data described above taken from PHIN’s unique, national private dataset describing discharge activity (day case and inpatient). This excludes activity outside of PHIN’s mandate from the Competition and Markets Authority, such as outpatient diagnostics and mental health.
There is a time lag between collecting, validating and processing the data we receive from hospitals before we can publish it. This can be up to 6 months after treatment has been completed, to ensure a fair process and accurate data.
Activity numbers have been rounded to the nearest 5, with percentage based on the unrounded figures.